|
B |
|
|
Rates your bank’s fee income production in 8 performance categories
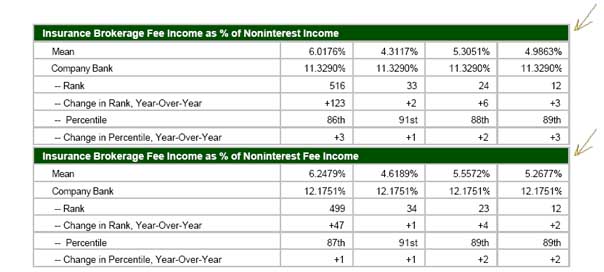
Insurance Fee Income Ratings Report Performance Categories Include: Total Bank Insurance Fee Income Bank Insurance Fee Income as a percent of Noninterest Income Bank Insurance Fee Income as a percent of Noninterest Fee Income Bank Insurance Fee Income as a percent of Net Operating Revenue Bank Insurance Fee Income per Bank Employee Bank Insurance Fee Income per Domestic Office Bank Insurance Fee Income as a percent of Retail Deposits Bank Insurance Fee Income as a percent of Total Assets Compound Annual Growth Rate in Insurance Fee Income for 1, 2 and 3 years
Investment Fee Income Ratings Report Performance Categories Include: Total Bank Investment Fee Income Bank Investment Fee Income as a percent of Noninterest Income Bank Investment Fee Income as a percent of Noninterest Fee Income Bank Investment Fee Income as a percent of Net Operating Revenue Bank Investment Fee Income per Bank Employee Bank Investment Fee Income per Domestic Office Bank Investment Fee Income as a percent of Retail Deposits Bank Investment Fee Income as a percent of Total Assets Compound Annual Growth Rate in Investment Fee Income for 1, 2 and 3 years
Mutual Fund and Annuity Fee Income Ratings Report Performance Categories Include: Total Bank Mutual Fund and Annuity Fee Income Bank Mutual Fund and Annuity Fee Income as a percent of Noninterest Income Bank Mutual Fund and Annuity Fee Income as a percent of Noninterest Fee Income Bank Mutual Fund and Annuity Fee Income as a percent of Net Operating Revenue Bank Mutual Fund and Annuity Fee Income per Bank Employee Bank Mutual Fund and Annuity Fee Income per Domestic Office Bank Mutual Fund and Annuity Fee Income as a percent of Retail Deposits Bank Mutual Fund and Annuity Fee Income as a percent of Total Assets Compound Annual Growth Rate in Mutual Fund/Annuity Fee Income for 1, 2 and 3 years
Income from Fiduciary Activities Ratings Report Performance Categories Include: Total Income from Fiduciary Activities Bank Income from Fiduciary Activities as a percent of Noninterest Income Bank Income from Fiduciary Activities as a percent of Noninterest Fee Income Bank Income from Fiduciary Activities as a percent of Net Operating Revenue Bank Income from Fiduciary Activities per Bank Employee Bank Income from Fiduciary Activities per Domestic Office Bank Income from Fiduciary Activities as a percent of Retail Deposits Bank Income from Fiduciary Activities as a percent of Total Assets Compound Annual Growth Rate in Investment Fee Income for 1, 2 and 3 years
|
|